If you want an in-depth lesson on candlestick bodies, you can search the web and find out all you need to know, but for now I will give a quick breakdown. Candlesticks are a visual representation of what the price did in a specific time frame. If you are reading a daily chart, it is the price action of that day.
The picture above shows the anatomy of a candlestick. It shows the open, high, low, and close of that time period. If the body of the candle is white, the stock or currency went up, while a black body means it went down. In a white candle, the bottom of the body is the open and the top is the close, where the black candle is the opposite. The upper shadow on both is how high price went during that time period, and the lower shadow indicates how low the price went. The bigger the candle, the more one side was in control. Smaller candles show indecision, and we look for them as a sign of a trend reversal, or future breakout. Large candles, however, can indicate a lot of enthusiasm in that direction, and we look for them to confirm the breakouts of our patterns.
If you need more of an explanation, you can do more research, but candle bodies are literally that simple. Now we need to figure out how to use them. Just like charts, candlesticks also form patterns that can give us an idea of the psychology of the market. Certain candles and combinations give us clues as to what people are thinking, which can help us decide where a stock or currency is going.
Spinning Tops
These candles have small bodies and long upper and lower shadows. This indicates indecision and, depending on where it occurs, could be the sign of a reversal. Look for these near areas of support and resistance to trade the bounce.
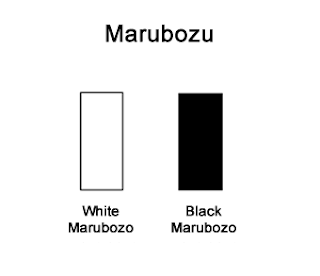
Marubozu
These long bodied candles have no shadows. In a white candle, the bottom is the open and the top is the close. Buyers were in control the entire day. A black candle is just the opposite. The top is the open, the bottom is the close, and sellers were in control. These candles are important because they can be used to confirm a breakout or a continuation of a pattern.
Doji
Doji have short bodies because the open is the same as the close. These candles show indecision in the market. The location of the doji can be an indication of future price movement.
If the doji appears after a series of black candles during a down trend, it may indicate that buyers are willing to step in and we may see a reversal up.
The same can be said about it's appearance after white candles in an uptrend. A doji is an indicator of indecision, and the buying may be over. In both situations, confirmation is required to make a trade, but we will get more into that later.


No comments:
Post a Comment