Thursday, March 30, 2017

Chart Lesson 10: Broadening Wedges, Descending

Broadening Wedges, Descending
Ranks:

Upward Breakouts:  Bull Market – 12/23, Bear Market – 14/19

Downward Breakouts:  Bull Market – 11/21, Bear Market – 6/21

Identification:

Shape:  Looks like a megaphone tilted down.  Both TLs slope downward with the LTL having a steeper slope.  They broaden out over time and neither is horizontal.

Breakout:  Look for patterns to break out in the direction of the current trend.

Partial Decline:  Price must touch the TTL, move down, turn around, and head higher without coming close to the LTL.  Look for an upward breakout.

Confirmation:  Wait for prices to close beyond the TLs before placing a trade.
Trade the TLs:  If the formation is especially broad, buy the LTL and sell at the top.  If it is a partial rise, close the position and look for a downward breakout.  Alternatively, sell short at the TTL once prices are heading down, and close the position if it rebounds off the LTL.


For Best Performance

• Trade with the trend: Select patterns with upward breakouts in a bull market, downward breakout in a bear market.

• Patterns in a bull market with an upward breakout have the lowest failure rates for extended moves.

• Bull markets throw back/pull back less often than do bear markets.

• Breakout day gaps help performance.

• A partial decline in a bull market correctly predicts an upward breakout
87% of the time and performance improves, too.

• In a bear market, look for a trend change 5 or 6 weeks after the breakout,
7 weeks in a bull market.

• Select patterns that are both tall and narrow. Avoid those that are short and wide.

• Patterns with a falling volume trend perform best when the breakout is upward. A rising volume trend does well for downward breakouts.


Tuesday, March 21, 2017

Chart Lesson 9: Dual Candlestick Patterns

Now that we've covered some important single candlestick patterns, we can cover some dual patterns.  We always want to wait for confirmation before entering a trade, and the dual patterns can be used for this.

Engulfing Candles:

The Engulfing Pattern can be identified with a small candle on the first day followed by a candle that engulfs the previous on the second day.  This pattern indicates a reversal is possible.

Tweezer Bottoms and Tops:
The Tweezer Pattern is also a reversal pattern that is identified with the first candle the same as the overall trend and a second candle that is opposite the overall trend.  The shadows should be equal lengths.


Thursday, March 16, 2017

Chart Lesson 8: Single Candlestick Patterns

Every lesson that I learn and write about should build on the last.  Hopefully these all get shown in the correct order that they should be learned.  This lesson will be about single candle patterns.  As prices approach certain levels such as support, resistance or yearly highs or lows, it is important to look for clues as to how the market will treat that level.  When these candles are spotted, both traders and investors are given a clue how the market feels about the price level, and what might happen next.

The Hammer and Hanging man

These Hammer and Hanging Man look identical but mean different things depending on where we spot them.  They can be identified by small bodies, short or missing upper shadows, and long lower shadows (2 to 3 times the size of the body).  The color of the body is not important, so long as it is at the top of the trading range (top of the candle).


The Hammer (left) is a Bullish Reversal pattern that forms in a downtrend and may be an indication of a bottom.  The color of the Hammer is not important, but a white candle may be considered more bullish.  A white candle on the next trading day can be confirmation of the reversal.  A buy order can be placed with a stop below the body of the Hammer.  The Hanging Man (right) is the opposite, bearish.  It is found after an uptrend and may indicate the top.  Again, the candle can be black or white, but black may be considered more bearish.  After getting confirmation of a black candle on the next day, a sell order can be placed with a stop above the body of the Hanging Man.  These are also good places to close existing positions if riding a trend.  You may want to consider moving a trailing stop or completely closing a position after spotting these candles.

Inverted Hammer and Shooting Star
The Inverted Hammer and Shooting Star are the exact same as the Hammer and Hanging Man except for their appearance.  Instead of small bodies with short upper shadows and long lower shadows, they have short lower shadows and long upper shadows.  When spotted in an up or down trend, they both signal a possible reversal.
Understanding these patterns can allow us to see a potential reversal, which will allow us to develop a plan and execute it.  Whether it gives up our entry or exit point, learning indicators is an excellent way to avoid making bad trades.  They can also help us minimize the damage of bad trades, and maximize the good ones.

Wednesday, March 15, 2017

Chart Lesson 7: Broadening Wedges, Adcending

Broadening Wedges, Ascending
Identification:

Shape:  Looks like a megaphone tilted up with two up-sloping trend lines (higher highs and higher lows).  The top trend line is steeper than the bottom, neither is horizontal.

Touches:  At least 3 touches or near touches on either side.

Premature Breakouts:  Are very rare.  A close below the lower trend line is usually a genuine breakout.

Breakout:  Downward the vast majority of the time.

Partial Rise.  Price touches the LTL, climbs toward the UTL, but fails to touch, price reverses and breaks out downward.

Volume:  Heavy on breakout.

Lowest Formation Low:  Is a natural area of Support.

Once recognizing the Broadening Wedges, Ascending formation:

When the price is going up:

Go Short at the high:  Sell short when the price starts heading down from the top trend line.

If price fails to touch the Top trend line:

Sell the Breakout Down:  Sell short through the breakout down.

When the price is going down:

Go Long at the Low:  Buy after the stock makes it’s turn at the lower trend line.

For Best Performance

• Most broadening wedges breakout downward.

• Trade with the market trend: Select wedges in a bear market with a
Down ward breakout or in a bull market with an upward breakout.

• The lowest failure rates occur with patterns in a bull market and
Up ward breakout.

• Throwbacks and pullbacks hurt performance. Look for overhead resistance or underlying support before trading.

• Breakout day gaps usually help performance.

• A partial rise or decline allows you to enter a trade sooner and usually predicts the breakout direction.

• Select tall or narrow patterns.


• Pick patterns with heavy breakout volume.

Friday, March 10, 2017

Chart Lesson 6: Broadening Tops

Broadening Tops

Identification:

*Formation preceded by an upward price trend*

Shape:  The formation looks like a megaphone tilted up with higher highs and lower lows.

Trend Lines:  Upper and Lower trend lines slope opposite of each other.  The upper line connects higher highs (resistance) while the lower line connects lower lows (support).

Once recognizing the Broadening Tops formation:

When the price is going up:

Buy the Breakout Up:  Set a buy order above the Upper Trend (resistance) line.

If the Breakout Fails:

Go Short at the High:  Sell short after the price starts heading down from the top of the trend line.

When the price is going down:

Sell the Breakout Down:  Set a sell order below the Bottom Trend (support) line.

If the Breakout Fails:

Go Long and the Low:  Buy after the price turns up off the Lower Trend (support) line.

*Set stop-loss orders $.15 below resistance and $.15 below support after breakouts*

Partial Decline:  Go long.  Add to position after upward breakout

For Best Performance

•          Select patterns in line with the market trend (bull market, upward breakout or bear market, downward breakout).

•          Bear markets decline at a steeper slope than bull markets rise, but the move is not as far.

•          Select patterns in a bull market with upward breakouts for the lowest failure rates.

•          Pick patterns with breakouts near the yearly low.

•          A partial rise or decline correctly predicts the breakout direction most of the time.

•          Select tall patterns.

•          Pick bull market patterns with a falling volume trend and bear market patterns with a rising volume trend.


Tuesday, March 7, 2017

Chart Lesson 5: Basic Candlestick Patterns

There is no single indicator that can accurately predict what direction a stock or currency will go in the future.  Only by combining our indicators do we start getting a strong sense of future direction.  This lesson will be about how Japanese Candlesticks can help us.  It can be found on BabyPips.com.

If you want an in-depth lesson on candlestick bodies, you can search the web and find out all you need to know, but for now I will give a quick breakdown.  Candlesticks are a visual representation of what the price did in a specific time frame.  If you are reading a daily chart, it is the price action of that day.

The picture above shows the anatomy of a candlestick.  It shows the open, high, low, and close of that time period.  If the body of the candle is white, the stock or currency went up, while a black body means it went down.  In a white candle, the bottom of the body is the open and the top is the close, where the black candle is the opposite.  The upper shadow on both is how high price went during that time period, and the lower shadow indicates how low the price went.  The bigger the candle, the more one side was in control.  Smaller candles show indecision, and we look for them as a sign of a trend reversal, or future breakout.  Large candles, however, can indicate a lot of enthusiasm in that direction, and we look for them to confirm the breakouts of our patterns.

If you need more of an explanation, you can do more research, but candle bodies are literally that simple.  Now we need to figure out how to use them.  Just like charts, candlesticks also form patterns that can give us an idea of the psychology of the market.  Certain candles and combinations give us clues as to what people are thinking, which can help us decide where a stock or currency is going.

Spinning Tops

These candles have small bodies and long upper and lower shadows.  This indicates indecision and, depending on where it occurs, could be the sign of a reversal.  Look for these near areas of support and resistance to trade the bounce.

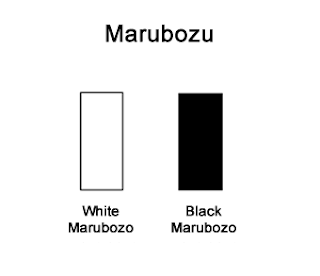
Marubozu
These long bodied candles have no shadows.  In a white candle, the bottom is the open and the top is the close.  Buyers were in control the entire day.  A black candle is just the opposite.  The top is the open, the bottom is the close, and sellers were in control.  These candles are important because they can be used to confirm a breakout or a continuation of a pattern.

Doji

Doji have short bodies because the open is the same as the close.  These candles show indecision in the market.  The location of the doji can be an indication of future price movement.
 If the doji appears after a series of black candles during a down trend, it may indicate that buyers are willing to step in and we may see a reversal up.
The same can be said about it's appearance after white candles in an uptrend.  A doji is an indicator of indecision, and the buying may be over.  In both situations, confirmation is required to make a trade, but we will get more into that later.


Sunday, March 5, 2017

Chart 6: Right-Angled and Descending pattern in NZDUSD chart


The key to getting better at charting is to look at tons of charts and draw lines connecting highs and lows until you find patterns.  While doing this, I found a Right-Angled and Descending pattern in the 1 hour chart for NZDUSD.  You can see the highs form a horizontal resistance line at the top, and the support line angles down connecting the lower lows.  The way to trade this is with the trend, which we can see is a downtrend.  Basically we are looking to short this as the price curls down off the top resistance and buy it back near support.  Also, as the price heads down to support, we would set a sell order below support to catch a breakout down (we look for a breakout in the direction of the current trend).  If the price has a partial rise off support, it is a sign of a breakout down, where we would short immediately.

Friday, March 3, 2017

Chart Lesson 4: Trading Support and Resistance

All of the information I post in Trading Lessons is a breakdown from a book or article that I have read.  I am very bad at siting my source, but I will give it my best effort.  This post on the topic of trading support and resistance comes from BabyPips.com.

Before we get into how to trade Support and Resistance levels, I will quickly explain them.  The stock and currency markets are just that, markets.  Buyers and sellers come to the market for different reason, but like all other markets, it is driven by supply and demand. When the price is dropping, it is because there are more sellers than buyers in the market.  There is too much supply and not enough demand.  Support is the level where buyers are willing to step in and start buying again.  Once support is established, the price will again begin to climb.  Sellers may take back over and drive the price back dawn, but that last support level will be the area to keep an eye on.  As price approaches the support area, it will either bounce up off it, or break through it.  I will get into that in a minute.  Resistance is the opposite of support.  When buyers are in control and there is too much demand for the supply, the price goes up.  Resistance is level where sellers decided to step in and sell, driving the price back down.  Like support, buyers may take back over and drive the price back up where the last resistance area will become key.   The image below will show you what I mean.

 The more the support and resistance levels are tested and hold, the stronger they become.  When a support or resistance level breaks, the strength of the move depends on how strongly the broken support or resistance had been holding.  Breaking through a strong level is a very significant move in that direction.

The next step in helping us trade support and resistance will be to draw trend lines.  There are 3 trend lines that can be drawn;  uptrend (highers highs), downtrend (lower lows), and sideways trend (same highs and lows).  In an uptrend, the lows are continuously getting higher.  A valid uptrend like requires at least 2 higher bottoms, and 3 to confirm the uptrend.  The downtrend is just the opposite.  It requires 2 higher lows to be a valid trend line, 3 to confirm the downtrend.  Sideways trends will have 2 highs and 2 lows that are nearly identical, 3 to confirm that it is trading in a range.


There are a couple of important things to remember with trend.  First is that it requires 2 tops or bottoms to be a valid trend line, 3 to confirm a trend.  Next, the steeper the trend line, the more likely it will break.  Last, like horizontal support and resistance levels, trend lines become stronger the more times they are tested.


Now that we can draw trend lines and find support and resistance, we can talk about how to use them.   There are two basic ways to trade support and resistance:  the Bounce, and the Break.  Sometimes support and resistance hold, and sometimes they don't.  How you trade these areas depends on whether you're a more aggressive or conservative trader.  Whatever happened last time price approached one of these levels is irrelevant, so you have to have a plan for this time.  Watching patterns set up is important because it allows you to have a plan in place when the price reaches one of these levels.

The first way to trade is called the Bounce.  Trading the bounce is how you trade when support and resistance hold.  This is done by buying after price has either bounced up off support, or down off resistance.  The important thing to remember with this trade is to WAIT FOR CONFIRMATION.  We will discuss types of confirmation later.  For right now, set your order above support or below resistance, but not at it.  As the price approaches one of these levels you should have an idea for your entry price, target price, and stop price.


The second way is to trade the Break.  Support and resistance levels do not always hold, so it is important to have a plan for that as well.  We generally want to see other indicators that may lead us to believe these levels will not hold, but we will get into that later.  The first way to trade the break is a more aggressive way.  We do this by setting an order to buy above resistance, or a sell order below support.  This method insures that we buy or sell only after the level failed to hold.

The more conservative way is to trade the pullback after the level has broken.  After a level has broken, price may return to the original level which, if it was support is now resistance, and if it was resistance is now support.  If the price pulls back, and order would be set above old resistance/new support, and below old support/new resistance.  


The next step is to go read some charts.  The best way to get good at charting is to practice finding all of the patterns you can in a chart.  Draw trend lines connecting highs to highs, and lows to lows.  Not every stock or currency is trending, but if you just start drawing lines, eventually you will find one that is.  The more you see patterns, the easier it will be to see them in the future, and eventually they will just pop out at you without even drawing.


Thursday, March 2, 2017

Chart 5: UNG trading in a Range of a Falling Wedge


UNG has been trending down since late last year.  The rising wedge from late December 2016 to late January of 2017 broke down to continue the trend.  The two horizontal green lines show that the natural gas fund has been trading in a range for almost two weeks, with price now touching SAR.  It is possible that as price gets to the lower support of $6.49, the buyers step back in a drive the price back up.  The trade we are watching is a break below support at $6.49, or above resistance at $6.77.  We will look for a doji candle in the coming days and weeks on higher volume, where we will then set one cancels the other buy and sell orders above resistance and below support in anticipation of a breakout of the range and the Falling Wedge.

Trading Lesson: Introduction

One of the subjects I am learning about is how to read charts.  Patterns form on a stock or currency's chart that can help give you an indication of what direction the price might be heading.  Knowing where the price MIGHT be heading is not enough, however, if you don't know how to trade it.  That is what Trading Lessons will cover.

I am currently using the School on BabyPips.com to do my research.  This is where the majority of my pictures and information will come from.  The school takes you through all levels of trading, from the basics to more advanced levels.  As I find interesting articles about trading, I will write about them.  The goal is to not only become great at charting, but also at trading, which will help me make money instead of losing it.

Many books and articles will lead you to believe that there is one way to trade.  You place a fixed amount of your money on a trade, set your stops at a specific place, and your sell order at another.  For professional traders who make their money by making a lot of trades and hoping for a specific return at a specific rate, this probably works.  This is not what I'm trying to accomplish, however.  I am not the type of person who could trade professionally, so my type of trading is different.  As of right now, I do not have the time to carefully watch charts all day to find the best possible entry, execute, and then wait for the best possible exit.  What I can do is look at charts periodically, find patterns setting up, and enter at a reasonable time.  I like to think of it as more of a hobby since it is actually entertaining for me.  Like my other hobbies, this one can make me money if I do it properly.

Trading as a hobby is still no excuse to lose money.  Hobbies should be fun, and making money is fun.  I would like to approach this hobby in the same way that geniuses approach their areas of expertise, by thinking outside the box.  Trading is an art, not a science, so I would like to do it my way.  This does not mean just the opposite of what conventional wisdom says a pattern means, but adapt all of the things I learn and treat each situation differently.  In order to adapt, however, I must first learn the basics and go from there.  My future posts will go in order from the BabyPips.com school's lessons.  Once basics are learned, I will then be able to practice trades in many different forms, and figure out what best works for me.